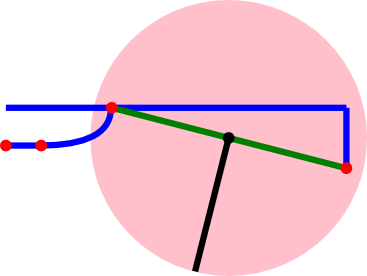
I’ve been struggling with creating bezier curves in an Inkscape SVG drawing from within a custom Inkscape extension written in Python. It turns out that it’s the formatting of the element call that was the problem. Here’s what worked for me – This is a simple example. I’ve included only one control point between the two end points. The first coord (x1,y1) in mypathattribs is the begin point and is designated by M to move the pen to that point, the last coord (x2,y2) is the end point and doesn’t require a designated label, and the control point in the middle (c1,c2) is designated by Q.
My wordpress template isn’t allowing me to have specific line indents, so if you cut and paste you’ll need to add indents for the lines within DrawQCurve.
def DrawQCurve(self,my_layer,x1,y1,x2,y2,c1,c2,mycolor):
mypathstyle  = {'stroke': mycolor, 'stroke-width': '15px', 'fill': 'none'}
mypathattribs = {'d': 'M '+str(x1)+', '+str(y1)+'Â Q '+str(c1)+', '+str(c2)+'Â '+str(x2)+', '+str(y2), 'style': simplestyle.formatStyle(mypathstyle)}
inkex.etree.SubElement(my_layer, inkex.addNS('path','svg'), mypathattribs)
Converting the numbers to string and storing them in variables and putting the variables in the mypathattribs didn’t work, although this method works with other SubElement calls. Placing the style information after the path definition was required as well, again this is different than with other SubElement calls. For some reason, I had to specify that the stroke-width was in pixels. I received error messages when ‘stroke-width’:’15’ was in mypathstyle, but didn’t for ‘stroke-width’:’15px’ . And again, this is different than with other SubElement calls. And appending ‘in’ for inches in the coordinate strings didn’t work even though it works for other calls, so I multiplied by 90 (90px per inch is default in Inkscape) to convert inches to pixels- I left this out because it wasn’t necessary for the example.
Woot!


